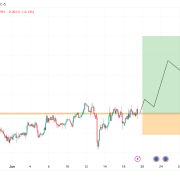
The GBP/INR and USD/INR exchange rates have moved sideways this week as investors waited for key economic data and events from the United States and the UK. The USD to INR pair was trading at 84.05 on Tuesday morning, a few points below the all-time high of 84.15.
On the other hand, the GBP to INR pair was trading at 109.05, a few levels below the year-to-date high of 112.50.
Reserve Bank of India interest rate cuts
The Indian rupee has wavered as concerns about the country’s inflation remained. Data released earlier this month showed that the headline Consumer Price Index (CPI) jumped from 3.65% in September to 5.50% in October, a bigger increase than the median estimate of 5.0%. It was the biggest inflation rate since December last year.
That reading came a few days after the Reserve Bank of India (RBI) published its interest rate decision. In it, as was widely expected, the bank decided to leave interest rates unchanged at 6.5%, where they have been for months.
Notably, the bank changed its monetary stance to neutral, meaning that it would consider cutting rates in the upcoming meetings. Indeed, Nagesh Kumar, the newest member of the committee voted to cut interest rates during that meeting.
The bank expects that food inflation will ease in the coming months, a notable thing since it makes up almost half of the CPI index.
There are signs that the RBI will delay its interest rate cut after the recent inflation data. According to TradingView, the 10-year government yield has risen to 6.86%, up from 6.70% in September. Similarly, the five-year has risen from 6.62% to 6.80%.
The Indian rupee has also reacted to some strong economic numbers. Data by S&P Global showed that the flash composite PMI rose to 58.6 in October from 58.3 in the previous month. It has been above 50 for 39 consecutive weeks, a notable thing since the PMI reading in most countries has remained below 50.
India’s manufacturing has been boosted by increased government spending and more investments as companies move out of China. The services PMI also jumped to 57.9 in October.
USD/INR analysis
The USD/INR pair has also moved sideways as investors focus on the US election and the key economic data from the country.
There are signs that the Donald Trump campaign is gaining momentum, especially after having a major rally in New York.
Data from the prediction market shows that he has a big lead, while Kamala Harris’s trend is moving in the opposite direction.
India would likely benefit from a Trump presidency because he has focused his ire on China. For example, he has announced that he would place a 40% universal tariff on all goods imported from China.
The USD/INR pair will also react to several important economic data to be released this week. On Tuesday, the US will publish the latest consumer confidence, JOLTS job openings, and the house price index (HPI).
The other notable data will be the first estimate of US Q3 GDP data, followed by the personal consumption expenditure (PCE) report. The PCE is a notable number because it is the Fed’s favourite inflation gauge.
Finally, the Bureau of Labor Statistics (BLS) will release the latest jobs numbers on Friday. All these reports will help to determine the next monetary policy by the Federal Reserve.
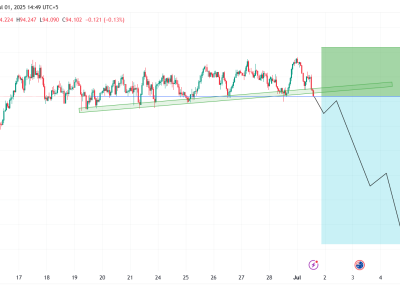
The USD to INR exchange rate has remained slightly above the 50-day and 25-day moving averages, while the MACD indicator has moved above the zero line. More gains will be confirmed if the pair rises above the resistance point at 84.14.
USD/INR chart by TradingView
GBP/INR analysis
The GBP/INR exchange rate will react to the upcoming UK budget, which will be the first one by a Labour government in 14 years.
Also, the pair will react to the upcoming Bank of England (BoE), which will happen next week. Analysts expect that the bank will cut rates by 0.25% in a bid to supercharge an economy that is doing modestly better than expected.
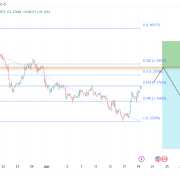
The daily chart shows that the GBP/INR pair has suffered a harsh reversal in the past few days. It has dropped from the year-to-date high of 112.50 to 109. The 50-day and 25-day Exponential Moving Averages have formed a bearish crossover pattern.
Also, the MACD indicator and the Percentage Price Oscillator (PPO) have also moved below the zero line. Additionally, the pair has moved below the key support at 109.26, its lowest point on September 11.
Therefore, the pair will likely continue falling as sellers target the key support point at 106.39, its lowest point on August 7.
GBP/INR chart by TradingView
The post GBP/INR, USD/INR analysis: Indian rupee braces for key events appeared first on Invezz


