The Indian rupee remained near its all-time low as the market reacted to the recent Reserve Bank of India (RBI) decision. The USD/INR exchange rate was trading at 83.93 on Friday, a few points below its all-time high of 84.15.
Similarly, the GBP/INR pair retreated to 109.61, down from the year-to-date high of 112.41. It has moved to its lowest level since September 11.
RBI interest rate decision
The biggest USD/INR and GBP/INR news this week was the RBI decision. As most analysts were predicting, the bank decided to leave interest rates unchanged at 6.50%.
However, the bank also changed its tone on inflation and potential rate cuts in the next meeting since inflation has moved to its target.
The most recent report showed that the headline CPI rose from 3.60% in July to 3.65% in August, higher than the median estimate of 3.5%.
Still, the figure has remained inside the bank’s target rate in the past few months. Nonetheless, officials have continued to worry about food inflation, which has remained at an elevated level in the past few months.
Analysts now expect the central bank to deliver its first interest rate cut in four years in the coming meeting in December. In a note, an analyst from ANZ Bank said:
“The bar for rate cut is still high, and contingent on food inflation subsiding. Our expectation is that the RBI will cut the rates in December, absent any shock in food prices.”
The cut means that the RBI is one of the last central banks to start trimming its benchmark rates. Other developed and emerging market central banks like in South Africa, China, and Brazil started slashing them months ago.
USD to INR analysis
The USD/INR also reacted to top events in the United States, which raised doubts on the next actions by the Federal Reserve.
Data released last week showed that the unemployment rate retreated to 4.1% in September while wage growth was strong. Another report also showed that the economy created over 254k jobs in September, higher than expected.
Meanwhile, inflation is not falling as quickly as expected. In a statement on Thursday, the statistics agency said that the headline Consumer Price Index (CPI) dropped from 2.5% in August to 2.4% in September.
Core inflation, which excludes the volatile food and energy prices, rose slightly to 3.3%, meaning that inflation was not falling as quickly as expected.
Therefore, the Federal Reserve will likely maintain a cautious view when cutting interest rates in the next meeting. The base case is where it continues gradually with 0.25% cuts instead of the jumbo cut it delivered in the last meeting.
Minutes released this week even showed that officials were divided on whether to cut rates by 0.25% or 0.50% in the last meeting.
USD/INR analysis
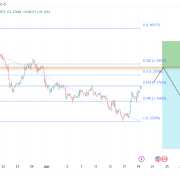
USD/INR chart by TradingView
On the daily chart, we see that the USD to INR exchange rate peaked at 84.14 earlier this year. It has then moved sideways as investors assess the next actions by the Federal Reserve and the RBI. It has remained slightly above the 50-day and 25-day moving averages.
The MACD indicator has moved slightly above the zero line, while the Relative Strength Index (RSI) has tilted upwards. Therefore, the pair’s outlook is neutral for now. More gains will be confirmed if it moves above the key resistance point at 84.15. A drop below the two moving averages will point to more downsides.
GBP to INR analysis
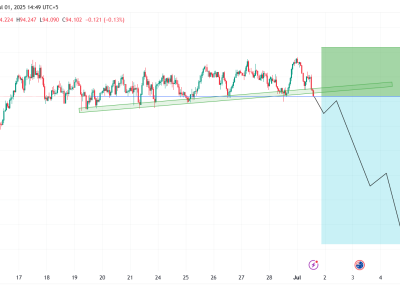
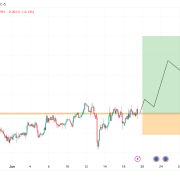
GBP/INR chart by TradingView
The GBP/INR pair pair will be in the spotlight as traders waited for Friday’s UK GDP data and next week’s inflation report.
These numbers will help to determine whether the BoE will continue its strategic pause in the next meeting or cut interest rates. Analysts expect the bank to take a more gradual pace of cutting these rates.
On the daily chart, the GBP to INR exchange rate peaked at 112.41 in September, and has been in a slow downward trend.
It has moved below the 50-day and 25-day moving averages, and the key support level at 111.32, its highest point on August 27.
The two lines of the MACD have made a bearish crossover, while the histogram has crossed the neutral line.
Also, the Relative Strength Index (RSI) has drifted downwards, and crossed the neutral point at 50. Therefore, the pair will likely continue falling, as sellers target the key support at 107.95, its highest swing in July last year.
A break below that level will point to more downside in the coming weeks. The alternative scenario is where it rebounds and retests the important resistance point at 111.32, its highest level on August 28. A break above that level will point to more gains ahead.
The post GBP/INR and USD/INR analysis: What next for the Indian rupee? appeared first on Invezz