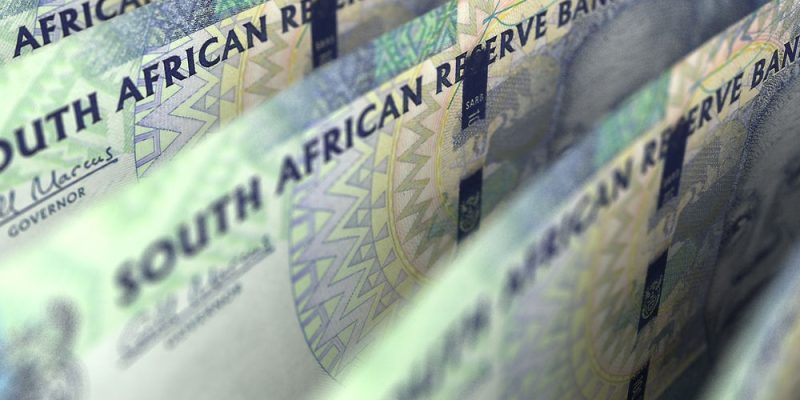
The South African rand has made a strong comeback, making it the best-performing emerging market currencies this year. The USD/ZAR exchange rate tumbled to 17.11, its lowest point since February 2023, and by over 14% from its highest level in 2023.
SARB interest rate cut
The USD/ZAR exchange rate continued its sell-off after the South African Reserve Bank (SARB) delivered the first interest rate cut earlier this month.
As was widely expected, the bank slashed rates by 25 basis points, the first time it did that since the pandemic started in 2020. It moved these rates from 8.25% to 8.0% and hinted that more cuts were possible.
The cut came a day after the statistics agency showed that the country’s inflation continued falling in August. The headline Consumer Price Index (CPI) fell to 4.4%, its lowest level since April 2021. It has steadily declined after peaking at 7.8% in 2022.
South Africa’s inflation has dropped mostly because of the strong rand, which has made importing crucial items like petroleum and food cheaper. Analysts expect inflation to continue easing in the coming months as the rand strengthens.
SARB hinted that it deliberated cutting rates or leaving them unchanged but judged that cutting was the best option to make. It also hinted that the next cuts will be gradual, with analysts expecting one more cut this year.
The SARB has joined other global central banks in slashing rates. In Africa, central banks in Kenya, Ghana, and Rwanda have started slashing rates as inflation moderated.
Federal Reserve actions
The USD/ZAR exchange rate has also dropped because of the recent Federal Reserve decision. In a meeting, the bank decided to slash interest rates by 0.50%, higher than some analysts expected.
The bank slashed rates after data showed that the country’s inflation was moving towards its target level.
Recent numbers revealed that the headline Consumer Price Index dropped from 2.9% in July to 2.5% in August. Core inflation, which excludes the volatile food and energy products, also eased a bit.
The personal consumption expenditure (PCE) report released on Friday showed that inflation continued falling. The headline figure improved to 2.2%, nearing the Fed’s target of 2.0%.
PCE is seen as the Fed’s favourite inflation gauge because it looks at price changes in rural and urban centers.
At the same time, the labor market has continued to weaken in the past few months, with the unemployment rate rising to 4.2%. Therefore, analysts expect the Fed to deliver more 0.25% rate cuts in the next few meetings.
Looking ahead, the key data to watch will be the nonfarm payroll (NFP) report, which will provide more color on the state of the labor market. Odds of more interest rate cuts will increase when these numbers show that the labor market deteriorated.
Commodity prices
The USD/ZAR exchange rate has also dropped because of the ongoing crude oil price crash. Brent has dropped to $71, while the West Texas Intermediate fell to $68. There are signs that prices will continue falling as Saudi Arabia abandons its $100 price target goal. South Africa benefits from low oil prices because it is a big importer.
It is also benefiting from the ongoing rebound of gold and other industrial metals like copper, iron ore, platinum, and palladium.
Gold has jumped to a record high, while these industrial metals have bounced back after China announced a series of measures to stimulate the economy.
Analysts expect that China’s stimulus measures and interest rate cuts will likely push commodities higher in the near term.
Additionally, the South African rand has soared because of the ongoing political environment that has seen the ANC and the Democratic Alliance form a coalition government.
USD/ZAR technical analysis
USD/ZAR chart by TradingView
Turning to the daily chart, we see that the USD to ZAR exchange rate peaked at 19.95 in 2023, and crashed to about 17 recently.
It has plunged below the important support level at 17.42, its lowest point since July 2023. Also, the pair has moved below the 50% Fibonacci Retracement level.
The pair remains below the 200-day and 50-day moving averages, which formed a death cross pattern in May. In most periods, this cross is one of the most bearish patterns in the market.
Also, top oscillators like the Relative Strength Index (RSI) and the MACD have continued moving downwards.
Therefore, the pair will likely continue falling as sellers target the 61.8% retracement point at 16.51. A break below that level will see the South African rand jump to 15.58, the 78.6% retracement point.
The post USD/ZAR analysis: How high can the South African rand go? appeared first on Invezz


